
- What Home Advantage Actually Measures
- How the Effect Varies by League and Competition
- Domestic Leagues With High Travel Burden
- Compact European Top Flights
- Reference Table for Recent Seasons
- Neutral Grounds and What They Strip Away
- Cup Finals and One Off Matches
- Relocated Domestic Fixtures
- Signals Worth Checking Before Any Prediction
- Where Venue Really Moves the Prediction Needle
Football results rarely turn on a single factor, yet the venue keeps surfacing in every serious post match analysis. Analysts talk about crowd noise, familiar surfaces, and travel fatigue as if they were fixed constants, when in practice the size of home advantage changes from league to league and from season to season. Understanding where the effect is genuine and where it is overstated is one of the cleaner edges available to anyone building predictions.
What Home Advantage Actually Measures
Home advantage is usually expressed as the share of points that home sides collect compared to their season average. Across most European top divisions, that share has historically sat between 55 and 60 percent, which is meaningful but far from decisive. The interesting question is why it exists at all, and which parts of it survive when the crowd is removed or the pitch is neutral.
Behavioural research after the 2020 season, when many matches were played in empty stadiums, showed that referee bias toward the home side shrinks noticeably without a crowd. Broadcast attention often drifts to unusual venues, and viewers who enjoy live formats sometimes toggle between a match feed and something like a crazy time live casino stream during half time, though the more useful takeaway from the empty stadium period was statistical, not entertainment based.
Fewer fouls were called against away teams, fewer yellow cards issued, and expected goals gaps narrowed. Home advantage did not vanish, but a chunk of it clearly lived in the referee whistle. For checking venue claims against real season numbers, the competition index at FBref collects season by season league data across dozens of competitions.
How the Effect Varies by League and Competition
The average hides enormous variation. South American leagues, where altitude and long domestic flights are real factors, show larger home effects than compact European competitions. Cup football, played at neutral finals, behaves differently again. Before trusting any general rule, it helps to look at the specific competition in front of you.
Domestic Leagues With High Travel Burden
In leagues that span large geographies, the away side often arrives after a long flight, sometimes across time zones. Brazilian Serie A and the Argentine Primera are frequently cited examples, and their home point shares tend to run higher than European averages. Altitude adds another layer in parts of the Andean qualifiers, where the physiological cost to visitors is measurable rather than folklore.
Compact European Top Flights
The Premier League, La Liga and the Bundesliga all sit closer to the 55 percent mark in recent seasons. Travel is short, pitch quality is uniformly high, and the tactical gap between home and away setups has narrowed as coaches share ideas more freely. In these competitions, form and squad depth typically explain more of the result than the venue does. Even fixtures with famously loud stadiums follow the pattern: the atmosphere shapes the broadcast far more than it shapes the scoreline, and a settled mid table side regularly out-earns its venue effect. That is also why venue models trained on one league transfer poorly to another without recalibration.
Reference Table for Recent Seasons
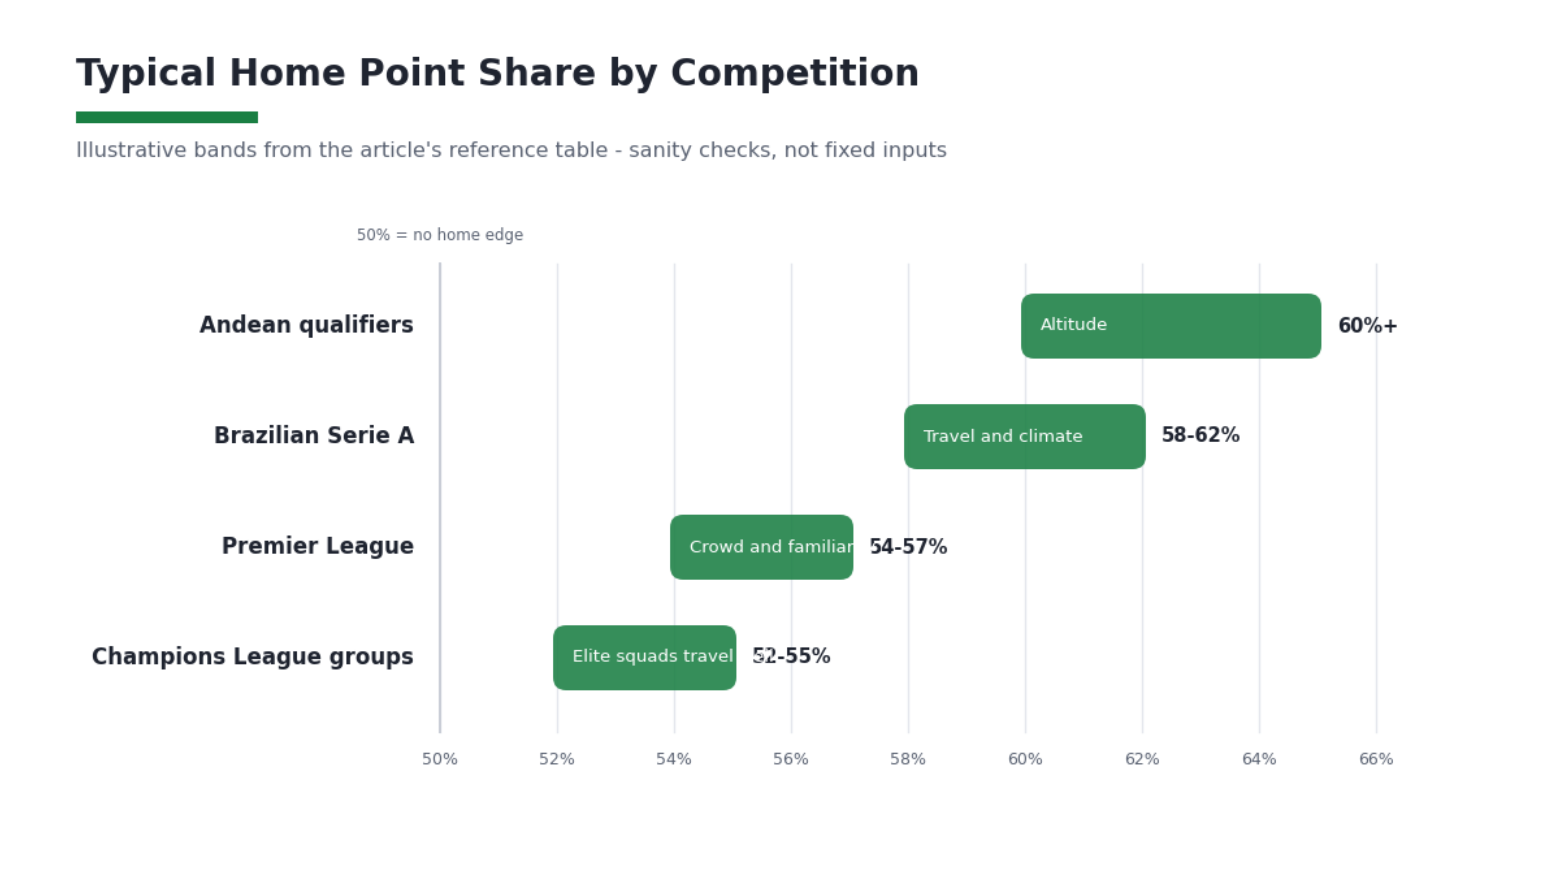
The figures below are illustrative bands drawn from publicly reported season summaries. Use them as sanity checks, not as fixed inputs.
| Competition | Typical Home Point Share | Main Driver |
|---|---|---|
| Premier League | 54 to 57 percent | Crowd and familiarity |
| Brazilian Serie A | 58 to 62 percent | Travel and climate |
| Champions League group stage | 52 to 55 percent | Reduced, elite squads travel well |
| Andean qualifiers | 60 percent plus | Altitude |
Neutral Grounds and What They Strip Away
Neutral venues remove the crowd bias, the familiar pitch dimensions, and any travel asymmetry between the two sides. That is why cup finals, continental deciders, and relocated fixtures behave more like coin flips than league form would suggest. The residual difference between the teams becomes almost entirely about squad quality and matchday execution.
Cup Finals and One Off Matches
Historic finals show that the pre match favourite wins roughly as often as market prices suggest, but variance is higher than in league play. Neither side gets to sleep in their own beds, warm up in a familiar tunnel, or hear a partisan stadium during the anthem. Set pieces, goalkeeping form, and individual moments carry more weight than they do across a 38 game season. Extra time and penalty shootouts stretch that variance further, which is part of why finals feel less predictable than league form suggests.
Relocated Domestic Fixtures
When a club plays a home fixture at a neutral venue because of stadium works or safety orders, the point return typically drops by three to five percentage points compared with that side’s usual home rate. It is not catastrophic, but it is consistent enough that model builders adjust for it. The same applies to sides forced to play in near empty stadiums during disciplinary sanctions. The effect fades with repetition, too. A club that spends a full season at a temporary ground slowly rebuilds a small home edge there, as players learn the sightlines and supporters settle into the new routine.
Signals Worth Checking Before Any Prediction
Before leaning on a home or neutral venue narrative, a short checklist keeps the analysis honest. The point is not to overweight venue at the expense of everything else, but to know when it earns its place in the reasoning.
- Is the fixture in a league where home share is genuinely elevated, or one where it is close to 55 percent
- Has the home side kept its usual training week, or is there European midweek travel in the recent schedule
- Is the referee assignment one known for tight enforcement, which historically dampens home bias
- Are attendance figures near capacity, or has the crowd been reduced by weather, sanctions, or scheduling
- For neutral venues, which side has the shorter travel and more recent experience of that specific stadium
None of these items are edges on their own. Combined with squad news and expected goals trends over the last six to eight matches, they help decide whether the venue narrative deserves a nudge in the projection or should be set aside entirely. A useful primer on the general phenomenon is the encyclopedic overview of home advantage, which collates several decades of academic findings.
Where Venue Really Moves the Prediction Needle
The honest summary is that venue is a modifier, not a headline. It matters most in leagues with real travel or altitude gaps, in matches with unusually strong or weak crowd factors, and in one off ties on neutral turf where the sample of past meetings is thin. In tightly packed European leagues between well matched sides, the venue effect is small enough that squad form, injuries and tactical fit usually deserve top billing.
For readers who bet or forecast recreationally, the practical rule is to quantify the venue adjustment rather than assume it. A three point swing in expected home share is worth including; a vague sense that home teams win more is not. Keep the reasoning specific to the competition, the week, and the two sides involved, and the venue question stops being folklore and starts being useful.
